Kubernetes AutoScaling Guide with Horizontal Pod Autoscaler (HPA)
Cloud Architect/Engineer with leadership and communication skills. Ownership of the entire lifecycle of a project (SDLC), and motivated to continue growing in Cloud and automation. Passionate about new technologies, responsible and enthusiastic collaborator dedicated to streamline processes and eciently solve project requirements.
Introduction
AutoScaling in Kubernetes is a critical feature that allows applications to automatically adapt to workload variations, ensuring optimal performance and efficient resource management within the cluster. The Horizontal Pod Autoscaler (HPA) is a tool that automates the adjustment of the number of pod replicas based on predefined metrics.
In this guide, you'll learn how auto-scaling works in Kubernetes through a real example HPA configuration.
What is Horizontal Pod Autoscaler (HPA)?
Scales the number of pod replicas horizontally based on metrics like CPU and memory utilization.
Ideal for applications with varying workload demands and where adding or removing identical replicas is effective.
Offers flexibility in adapting to changing traffic and resource needs.
Requires that applications are designed to be stateless or capable of handling pod replication.
Key Considerations
In the journey to optimize your Kubernetes deployment and ensure efficient autoscaling, it's essential to weigh the factors that influence your choice of an autoscaling solution. There are several considerations that should be aligned with your application's requirements and broader objectives:
Application Suitability: Evaluate if your application can benefit from horizontal scaling.
Resource Metrics: Ensure that your performance bottlenecks relate to metrics like CPU and memory.
Cluster Size: Consider the cluster's size and capacity for effective autoscaling.
Monitoring and Alerting: Implement monitoring and alerting for resource utilization and performance.
Pod Design: Ensure pods are stateless and replicable for effective HPA.
Testing: Thoroughly test HPA in a non-production environment.
Scaling Policies: Define clear scaling policies aligned with your objectives.
Resource Quotas: Be aware of resource quotas to prevent overscaling.
Cost Implications: Understand how autoscaling affects cloud infrastructure costs.
Maintenance and Updates: Keep configurations and policies up to date.
Alternative Solutions: Consider alternative autoscaling solutions like Vertical Pod Autoscaler or custom controllers if they better fit your use case.
HPA Configuration Example
apiVersion: autoscaling/v2
kind: HorizontalPodAutoscaler
metadata:
  name: app-autoscaler
  namespace: app-namespace
spec:
  scaleTargetRef:
    apiVersion: apps/v1
    kind: Deployment
    name: app-deployment
  minReplicas: 5
  maxReplicas: 15
  metrics:
  - type: Resource
    resource:
      name: cpu
      target:
        type: Utilization
        averageUtilization: 75
  behavior:
    scaleDown:
      stabilizationWindowSeconds: 300
      policies:
      - type: Percent
        value: 25
        periodSeconds: 10
    scaleUp:
      stabilizationWindowSeconds: 0
      policies:
      - type: Percent
        value: 100
        periodSeconds: 15
      - type: Pods
        value: 2
        periodSeconds: 15
      selectPolicy: Max
Explanation:
metadata: In this section, you set the name and namespace of the HPA.
spec: Here, you define the HPA's characteristics:
scaleTargetRef: It selects the resource to be automatically scaled, in this case, the Deployment named "app-deployment."
minReplicas: It ensures that at least 5 pod replicas are always running.
maxReplicas: It allows a maximum of 15 pod replicas.
metrics: These metrics specify the criteria for scaling decisions. In this example, CPU usage is used with an average utilization target of 75%.
behavior: It configures the scaling behavior:
scaleDown: Specifies how scaling down occurs. If CPU usage decreases by 25% within a 10-second window, it will reduce the number of replicas.
scaleUp: Defines how scaling up is performed. If CPU usage exceeds 100% within a 15-second window or if the number of pods exceeds the 15-second window by 2, it will add more replicas.
Monitoring HPA in Kubernetes
Monitoring Horizontal Pod Autoscaler (HPA) is essential to ensure effective autoscaling. Several monitoring mechanisms should be considered and used accordingly depending on several factors, such as the project, application and team expertise. For the scope of this article, we're going to evaluate prometheus/grafana as the main monitoring approach:
Install Prometheus and Grafana:
Deploy Prometheus and Grafana in your Kubernetes cluster using Helm charts or manual installation.
Set up Prometheus to scrape HPA-related metrics by adding a scrape configuration to your Prometheus config.
Create or import Grafana dashboards tailored for HPA monitoring. Customize them to fit your needs.
Visualize Key Metrics:
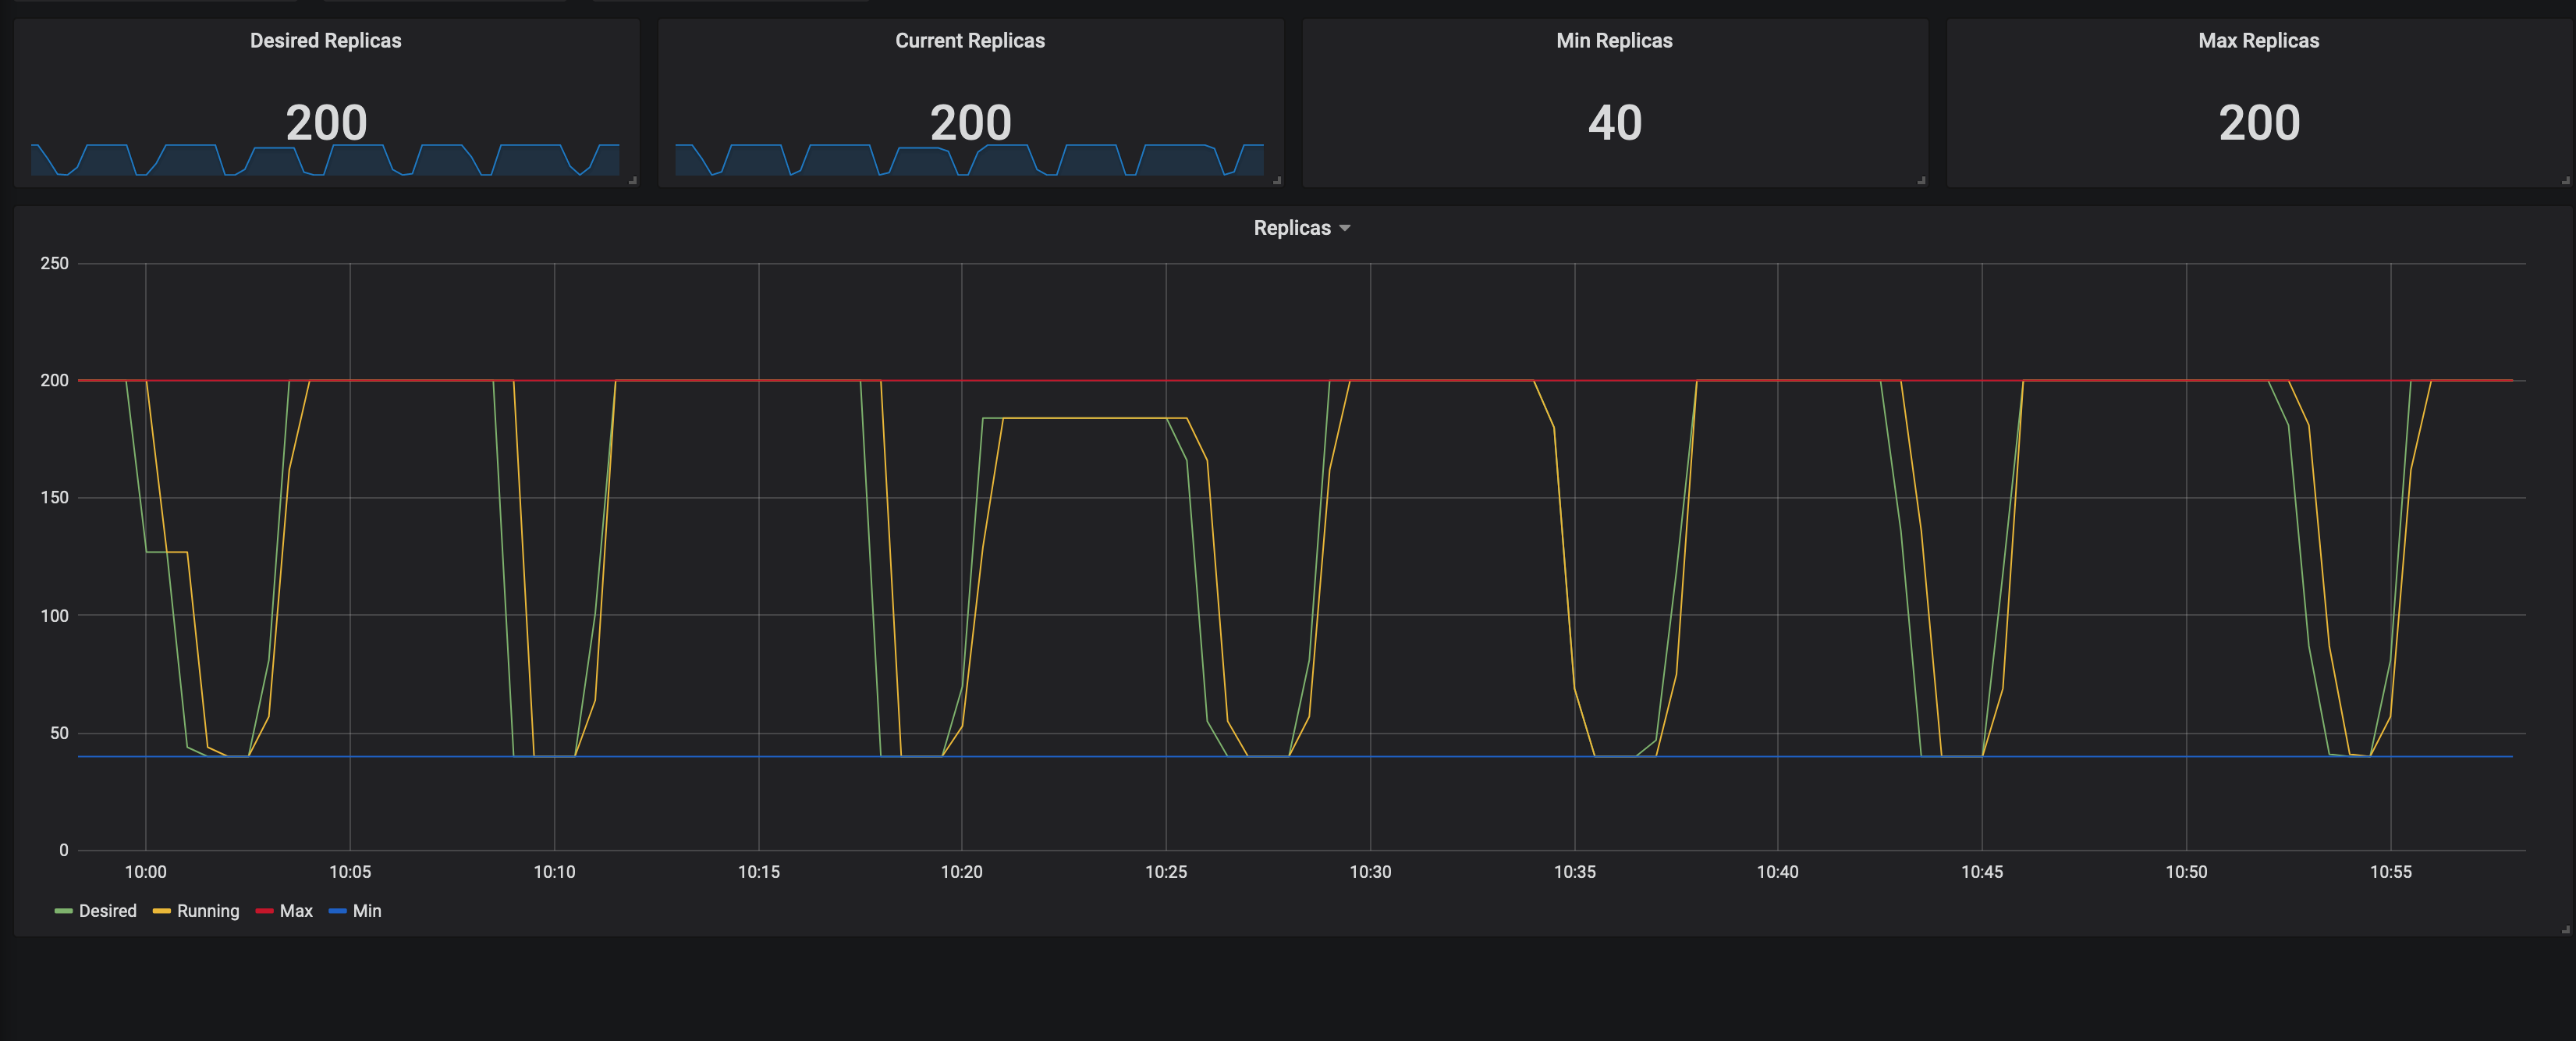
In Grafana, visualize metrics like CPU and memory utilization, replica counts, and scaling events.
- Example:
- Set up alerts for scaling events and resource utilization thresholds.
Evaluate Scaling Performance:
Monitor HPA behavior, ensuring it scales pods in response to changing workloads.
Analyze historical data to optimize scaling configurations.
Continuous Monitoring:
- Regularly review and adjust your monitoring setup to proactively address scaling issues and anomalies.
Enhance with Logging and Tracing:
- Consider adding logging and tracing solutions for deeper insights during scaling events.
Conclusion
The use of the Horizontal Pod Autoscaler (HPA) in Kubernetes is essential to ensure that applications can automatically adapt to changes in workload demand. This configuration maintains a minimum number of active replicas (5 in this case) and scales up to a maximum of 15 replicas based on CPU utilization.
As resource needs change, the HPA will automatically adjust the number of replicas to ensure optimal performance and efficient resource management within the cluster. AutoScaling is fundamental for ensuring availability and performance in dynamically changing Kubernetes environments.
![[Lab] AWS Lambda LLRT vs Node.js](/_next/image?url=https%3A%2F%2Fcdn.hashnode.com%2Fres%2Fhashnode%2Fimage%2Fupload%2Fv1715799253631%2F9f12f208-484e-499e-9324-ec4f37855660.png&w=3840&q=75)